2026: The Year for Mid-Cap Growth
Analyzing the opportunity and weighting of US mid-cap stocks. Stay ahead with real-time market news, expert tips, and community discussions—all designed to help you grow your portfolio confidently.
Marc-Anthony Richardson MBA, CPM
1/2/20266 min read


Market pulse
Article Summary
U.S. mid-caps have the potential to be the cornerstone of a successful growth portfolio in 2026: large enough to be durable, small enough to compound faster than mega-caps.
Macro environment supports a broader growth picture, with easing rates, resilient corporate earnings, and a shift from concentrated mega-cap gains within tech to a more dynamic portfolio composition.
Mid-caps look under-owned versus their share of total US equity market value—creating a buy opportunity.
Valuation is supportive: research shows mid-caps trading at a meaningful discount to large caps.
Stock selection matters: focus on pricing power, strong balance sheets, and clear demand tailwinds (infrastructure, industrial upgrading, cybersecurity, value-focused consumers).
Figure 2: Mid-caps have a larger portion of total US equity market value than their actual share of US assets (AUM), creating room for reallocation.
Thesis: 2026 Favors the Middle of the Market
After three straight years of double-digit US equity gains, investors enter 2026 with higher expectations, higher dispersion across stocks, and a market influenced by a narrow set of mega-cap winners. That backdrop is historically fertile for mid-caps, which are companies with a market capitalization between $2 bn and $10 bn—especially when monetary policy is easing and growth remains positive.
Easing Policy Tends to Broaden Performance Beyond Mega-Cap
Mid-caps typically carry more 'rate sensitivity' than mega-caps: they rely more on domestic demand, bank lending, and capital spending cycles. When financial conditions ease, the opportunity set often expands beyond the largest names.
Mid-caps Make Up the Core of the U.S. Supply Chain
The AI buildout is not just a software story; it is also power, data centers, construction, industrial automation, logistics, and security. Mid-caps have the most to gain from this evolution as they can be more nimble than their larger competitors and can incorporate these new systems more efficiently. This presents a unique opportunity for mid-cap companies to increase their output, bridge service gaps, and etch away at the overall market share.
Figure 1: Compared to large caps (SPY), mid-caps (IWR) carry more weight in cyclically sensitive sectors like Industrials and Financials, and less weight in Tech.
Valuation and Positioning Provide a Margin of Safety
Mid-caps have been described as the market's 'forgotten middle'—a segment that represents a meaningful share of overall US equity market value yet a smaller slice of how investors allocate equity assets. Combined with a valuation discount versus large caps, the setup can be attractive.
Why Mid-caps Can Present a Performance Edge Against the Broad Market.
Lower concentration risk: mid-cap indexes are typically less dominated by a handful of names than their large-cap counterparts.
More runway: mid-caps can expand TAM, margins, and market share faster than mature mega-caps.
M&A optionality: mid-caps are frequent acquisition targets when capital markets reopen.
Domestic leverage: many mid-caps are tied to US consumption, infrastructure, and re-shoring more directly than global mega-caps.
How the stock list was built
The US list is constrained to companies with market capitalizations between $2B and $10B, spread across four industries. The goal is not to predict the single best stock—it is to build a diversified set of 'probable winners' if the mid-cap thesis plays out.
Quality screen: recognizable business models, recurring revenue or repeat-demand products, and evidence of pricing power.
Macro linkage: each pick ties to a 2026 tailwind (infrastructure, industrial upgrading, digital transformation, cybersecurity, value-focused consumers).
Risk control: avoid excessive leverage; prioritize operational execution and cash generation.
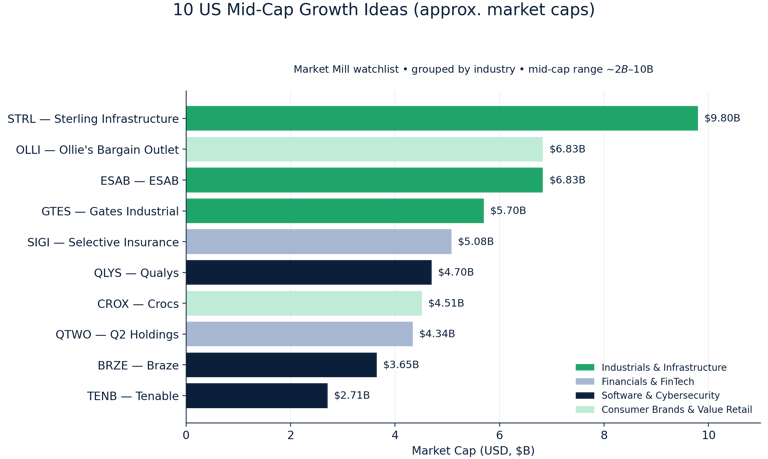
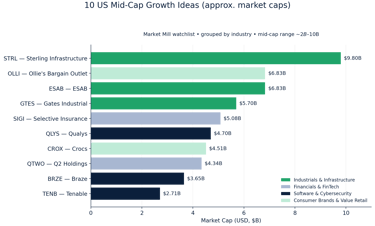
10 US mid-cap growth candidates for 2026
Market caps shown are approximate and based on public data snapshots in early January 2026.
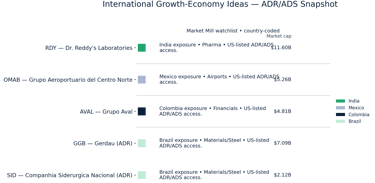
5 international growth-economy ideas via US-listed ADRs/ADS
These names offer exposure to faster-growing regions and local cycles. All are available to US investors through US listings (ADR/ADS). Market caps are approximate (early Jan 2026).
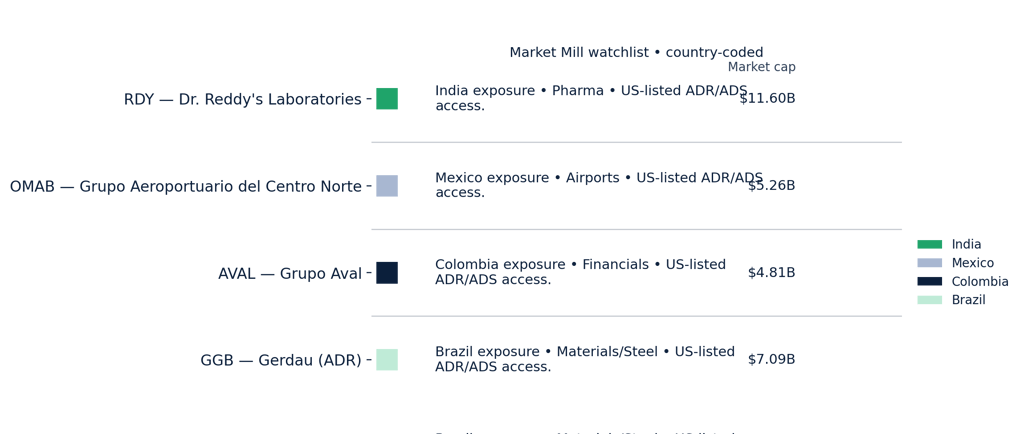
International Catalysts
· RDY — Product launches + margin discipline; US generics and India growth.
· OMAB — Passenger growth + commercial revenue per passenger; capex discipline.
· AVAL — Credit growth, net interest margin, and macro stabilization in Colombia.
· GGB — Brazil demand + cost curve; dividends and balance sheet management.
· SID — Steel/iron ore cycle; leverage and cash-flow discipline.
What could break the thesis
· Inflation re-accelerates, pushing yields higher and compressing valuations.
· A sharp recession or credit event tightens lending standards and pressures mid-cap balance sheets.
· AI capex disappoints or remains extremely concentrated, keeping leadership locked in mega-cap tech.
· Geopolitical shocks disrupt supply chains or energy prices, reducing corporate confidence.
Conclusion
The base case for successful Mid Caps in 2026 does not require a boom—just steady growth with easing financial conditions. In that environment, investors often rotate from crowded, highly concentrated winners toward the broader market. Mid-caps can occupy the sweet spot: they participate in big investment cycles while still having runway for fundamental compounding.
References
Reuters (Jan 2, 2026): mid-cap funds saw outflows during 2025 while large-cap funds drew inflows (positioning/backdrop).
ETFTrends (Sep 24, 2025): Russell Midcap valuation discount (~25.5% trailing P/E discount vs S&P 500).
Mackenzie Investments (Oct 31, 2025): mid-caps represent >20% of Russell 3000 market cap but ~6% of US equity assets (AUM).
Invesco (mid-cap insights): long-run mid-cap outperformance vs large and small caps since Russell Midcap Index inception.
VanEck (Oct 11, 2024): prior easing cycles since 1995 show small and mid-caps outperforming during declining-rate periods.
Federal Reserve (Summary of Economic Projections, Dec 2025): policy-rate projections for 2026/2027 (macro backdrop).
SSGA SPY sector breakdown (as of Dec 31, 2025) and BlackRock iShares IWR fact sheet sector breakdown (late 2025).
StockAnalysis.com / Yahoo Finance / CompaniesMarketCap (early Jan 2026): market cap snapshots for the companies listed.
Disclosures & Important Information
For informational and educational purposes only. This article is provided for general informational and educational purposes and does not constitute investment, legal, accounting, or tax advice.
Not a recommendation or solicitation. Nothing in this article should be construed as a recommendation, offer, or solicitation to buy or sell any security, investment product, or strategy, nor to engage in any particular transaction.
Not individualized advice. The information presented is not tailored to the investment objectives, financial situation, or needs of any specific person. You should consider your own risk tolerance, time horizon, liquidity needs, and tax circumstances, and consult with a qualified professional before making any investment decision.
Risk of loss / no guarantee. All investing involves risk, including the possible loss of principal. No investment strategy can assure a profit or protect against loss in all market conditions. Diversification does not ensure a profit or guarantee against loss.
Past performance. Past performance (including any historical returns, charts, or examples referenced) is not indicative of future results.
Forward-looking statements. Any forward-looking statements, forecasts, targets, or projections are based on assumptions and current expectations as of the date of publication and are subject to change without notice. Actual outcomes may differ materially due to market, economic, political, regulatory, and other factors.
Data sources and accuracy. Data and commentary may be derived from public sources believed to be reliable, but accuracy and completeness are not guaranteed. Figures may be rounded, and charts may be simplified for illustration.
Third-party content. References to third-party information, indexes, research, or websites are for convenience only and do not constitute an endorsement. Indexes are unmanaged and not available for direct investment.
Securities mentioned. Any securities or sectors referenced are presented for illustrative and educational discussion and may not be suitable for all investors.
Conflicts of interest. I am a licensed Investment Adviser. I, my firm, and/or clients may have positions in securities discussed (long or short) and may buy or sell such securities without notice. This may create a potential conflict of interest.
Advisory relationship. Reading this article does not create an adviser-client relationship. Advisory services are provided only under a written agreement and in jurisdictions where properly registered or exempt.
Figure 3: Russell Midcap valuations have been cited at a notable discount versus the S&P 500 (normalized for clarity).
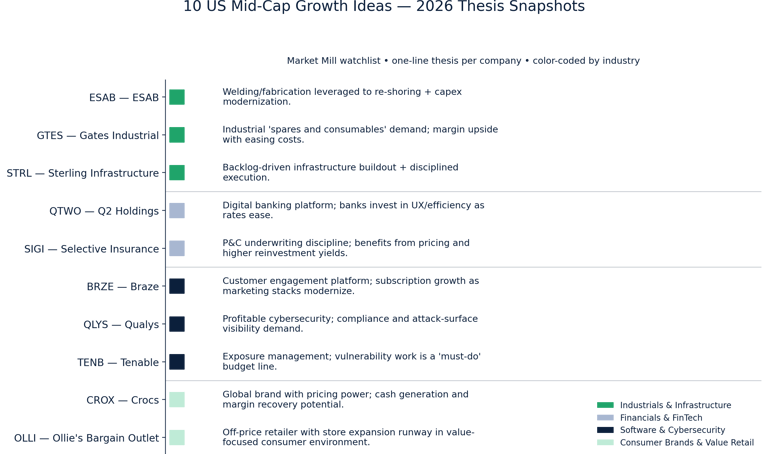
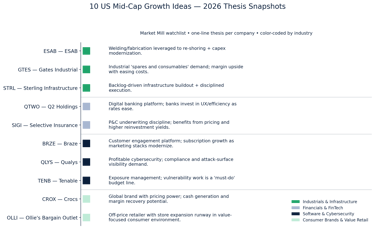
Figure 4: Market Mill Selection 10 US mid-cap candidates and rationale.
Figure 5: Market caps of the 10 US mid-cap candidates (approximate, early Jan 2026).
Figure 6: 2026 International Mid-Cap Portfolio Ideas