2026 Market Mill Outlook
A cautiously optimistic outlook, strong corporate earnings beyond the Magnificent 7.
Marc-Anthony Richardson MBA, CPM
1/1/20268 min read


Market pulse
Article Summary
Base case: the U.S. will likely avoid a recession, annual growth will stay near 2%, and inflation and interest rates will cool gradually.
Most important change vs 2023–2025: earnings growth should broaden beyond the “Magnificent 7,” which can improve opportunities in mid‑caps and sector leaders outside large tech.
Infrastructure spending (roads/bridges, rail, transit, ports, grid) is moving from planning to visible construction—supporting industrial activity, logistics efficiency, and select materials/engineering firms.
Global growth is still strongest in parts of emerging markets (notably India), while several developed regions (Europe/Japan) look slower but potentially offer valuation advantages.
Main risks: sticky services inflation, policy/tariff shocks, geopolitics (especially China‑adjacent), and a surprise earnings slowdown.

What 2025 Taught Us
My 2025 recommendation results showed a powerful pattern: when you mix “big, high‑quality leaders” with a few high‑conviction mid/small cap stocks, the upside could be dramatic. Also, if you pair those quality stocks with high dividend-paying stocks and investment-grade bonds, we can see steady income inside a portfolio while offsetting market volatility, as we witnessed during the “spring dip” in 2025 —but the losers (often commodity‑sensitive or highly cyclical, consumer discretionary names) dragged the overall market, as we all predicted, with tariff-centric policy being the main catalyst. The following is the scorecard of my Q1 industry lists and full‑year 2025 performance.
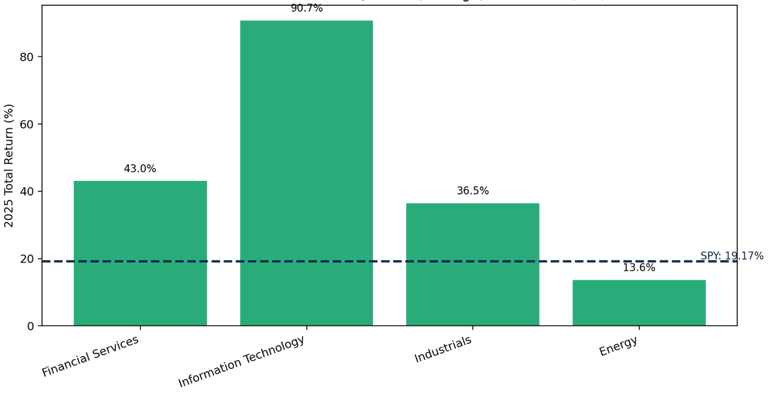
Figure 1: Q1 2025 individual stock selection performance by industry, against SPY (S&P 500 proxy).
At the beginning of 2025, I identified 4 industries to focus my sock recommendations – Financial Services, Information Technology, Industrials, and Energy. Of my selections, 3 of the 4 industries outperformed the S&P 500. My Financial Services picks averaged 43.0%, Information Technology averaged 90.7%, Industrials averaged 36.5%, and Energy averaged 13.6%, versus SPY at 19.17%.
Key Takeaways from 2025:
Tech and Industrials delivered strong breadth: 73% of Tech picks and 88% of Industrials picks beat SPY.
Energy was a tale of two markets: grid‑linked power (NRG) was a big winner, while some exploration/production names struggled—showing how “energy” isn’t one trade.
Financials did well when the thesis was “quality + operating leverage” (large banks and select non‑bank lenders), but laggards tended to be more rate‑sensitive or idiosyncratic.
2026 Macro Backdrop
See the current economy like driving on a highway after a storm. The road is mostly clear, but you still keep both hands on the wheel. Most mainstream forecasts point to moderate growth and a slow glide to lower inflation and interest rates—not a boom, not a bust.
What This Means for Investors
If rates drift down slowly, quality matters: strong balance sheets and real cash flow tend to win when money is not “free,” but also not scarce.
A broadened earnings cycle is friendlier to mid‑caps and sector leaders outside mega‑cap tech.
Lower inflation volatility can reduce “shock risk,” helping long‑term planning and business investment.
Figure 2: Q1 2025 individual stock selection year end performance -- winners and losers..
Figure 3: 2026 market outlook expectations by mainstream analyst consensus.
Infrastructure: From Plans to Pavement
When you upgrade the country’s “bones” (roads, bridges, ports, power lines), you don’t just create construction jobs—you reduce delays, shorten delivery times, and improve productivity. That can ripple into corporate margins across transportation, manufacturing, services, and consumer goods.
High‑visibility Examples:
LA Metro D Line Extension (Los Angeles): a major transit expansion expected to open in phases.
Sound Transit 3 (Seattle region): multi‑year expansion of light rail and transit infrastructure.
Hudson Tunnel Project / Gateway Program (NY/NJ): critical Northeast Corridor capacity and reliability upgrades.
Brightline West (Las Vegas to Southern California): private-led high‑speed rail with federal support.
Grid modernization and transmission upgrades: improving reliability and enabling more capacity.
Figure 4: 2026 market outlook expectations by mainstream analyst consensus.
Who Benefits Most
Engineering & construction managers (project backlogs).
Aggregates/cement and specialty materials (inputs).
Rail and logistics enablers (efficiency gains).
Electrical equipment and grid hardware/software (modernization).
Global View: Where to Focus and Where to Be Careful
Global investing is like choosing neighborhoods in a growing city: some areas have faster population and income growth, others are cheaper, and a few carry higher safety risks. Growth alone isn’t enough—policy stability and geopolitics matter, too.
United States: still the deepest innovation pipeline (AI, software, biopharma, capital markets), and infrastructure capex supports industrial breadth.
India: strongest large‑economy growth profile, with long runway in digitization, manufacturing, and domestic consumption.
Japan (select): slower growth, but reforms and shareholder‑friendly changes can improve returns—often with lower valuations than the U.S.
Mexico / nearshoring corridor (select): manufacturing supply chains can benefit, but growth is more modest—be selective.
Markets To Approach Cautiously
China: growth is moderating, and geopolitical/regulatory risk remains elevated; emphasize risk‑controlled exposure if any.
Parts of Europe: slower trend growth; opportunities exist, but catalysts can be harder to find without a sector‑specific thesis.
Highly leveraged frontier exposures: avoid “yield traps” when global liquidity tightens.
Figure 5: 2026 growth estimates by target countries/regions.
Figure 6: 2026 opportunity/risk scorecard by select countries/regions.
2026 Industry & Stock Playbook
Below is a list of industries that I place an overweight focus on, as well as industries I recommend being underweight. This framework follows my industry recommendation structure: thesis → catalysts → risks → example names:
Infrastructure & Industrials: Core Overweight
Thesis: multi‑year project backlogs + logistics efficiency gains can lift earnings beyond mega‑cap tech. Examples:
Mega/Large: GE (aerospace/industrial), RTX, EADSY (defense & aero), CAT (machinery), UNP (rail).
Mid: MTZ (engineering & construction), STRL (specialty construction), AMSC (grid-related solutions—higher risk).
Small/Speculative: RDW (space/industrial—high volatility; position size carefully).
Technology: Selective Overweight.
Thesis: AI spend expands from chips to software, networking, security, and “picks-and-shovels” infrastructure. Examples:
Mega: MSFT, GOOGL (platform + AI monetization).
Large: AMAT (semi equipment), META (AI + advertising cycle).
Mid/Small: CLS, CRDO, UI (infrastructure/networking) — strong upside, but watch valuation and execution risk.
Financials: Neutral to Modest Overweight
Thesis: stable growth + improving liquidity conditions favor high‑quality banks/insurers, lower interest rates for new loan business; avoid weak balance sheets. Examples:
Mega/Large: JPM, WFC (scale + diversified earnings).
International: HSBC/BCS (macro + FX sensitivity—size positions appropriately).
Avoid/Underweight: weaker regional banks with concentrated CRE risk; insurers with pricing cycle turning down.
Energy & Power: Tactical Quality + Grid Leaders
Thesis: the best opportunities may be tied to power demand (AI/data centers) and grid investment—not just oil prices. Examples:
Large: CVX/XOM (quality integrated—income + durability).
Power/Utilities-adjacent: NRG (example of “power demand” theme).
Midstream income: EPD/ET/WES (cash-flow focus; monitor regulatory and commodity volume risk).
Avoid: highly levered E&P names where returns depend on perfect commodity timing.
Industries to be careful with in 2026
Unprofitable long‑duration “story stocks” (most sensitive if rates stay higher for longer).
Highly cyclical consumer names if real wage growth cools and savings rates rise.
Over‑leveraged real estate exposure (especially office) where refinancing risk remains.
The Bond Market
As the Fed continues to monitor and ease rates, my stance remains the same: If you are seeking income, lock in medium-term (around 5-year duration) investment-grade corporate bonds if you haven't done so already. At the time of writing this article, there are favorable callable investment-grade corporates that are yielding between 4.5% - 5% annually (Yield to Maturity). Municipal bonds remain very attractive for those with the appetite for a very long duration (30-year term), enabling long-term tax-free income. This will continue to be the case throughout 2026. The tax equivalent yield for moderate and short-duration municipal bonds is lower than the after-tax yield of their investment-grade corporate bond duration equivalent under the current income tax brackets.
Bottom Line
A cautiously optimistic 2026 is favorable for the broad market investor: if earnings broaden, you can look beyond the mega‑cap winners and find growth in industrial backlogs, grid modernization, and tech infrastructure. The goal for the typical retail investor is simple: own quality, diversify across themes, and don’t let one headline move your long‑term plan.
References
IMF World Economic Outlook (Oct 2025) + IMF DataMapper country profiles (US, India, Mexico).
Federal Reserve Summary of Economic Projections (Dec 10, 2025) and summaries.
CBO economic projections (Sep 2025).
Bipartisan Infrastructure Law / IIJA funding breakdowns (White House archives, USDOT, EPA water fact sheet).
Project pages: LA Metro D Line Extension; Sound Transit 3; Gateway Program / Hudson Tunnel; Brightline West; DOE grid modernization notes.
Disclosures & Important Information
For informational and educational purposes only. This article is provided for general informational and educational purposes and does not constitute investment, legal, accounting, or tax advice.
Not a recommendation or solicitation. Nothing in this article should be construed as a recommendation, offer, or solicitation to buy or sell any security, investment product, or strategy, nor to engage in any particular transaction.
Not individualized advice. The information presented is not tailored to the investment objectives, financial situation, or needs of any specific person. You should consider your own risk tolerance, time horizon, liquidity needs, and tax circumstances, and consult with a qualified professional before making any investment decision.
Risk of loss / no guarantee. All investing involves risk, including the possible loss of principal. No investment strategy can assure a profit or protect against loss in all market conditions. Diversification does not ensure a profit or guarantee against loss.
Past performance. Past performance (including any historical returns, charts, or examples referenced) is not indicative of future results.
Forward-looking statements. Any forward-looking statements, forecasts, targets, or projections are based on assumptions and current expectations as of the date of publication and are subject to change without notice. Actual outcomes may differ materially due to market, economic, political, regulatory, and other factors.
Data sources and accuracy. Data and commentary may be derived from public sources believed to be reliable, but accuracy and completeness are not guaranteed. Figures may be rounded, and charts may be simplified for illustration.
Third-party content. References to third-party information, indexes, research, or websites are for convenience only and do not constitute an endorsement. Indexes are unmanaged and not available for direct investment.
Securities mentioned. Any securities or sectors referenced are presented for illustrative and educational discussion and may not be suitable for all investors.
Conflicts of interest. I am a licensed Investment Adviser. I, my firm, and/or clients may have positions in securities discussed (long or short) and may buy or sell such securities without notice. This may create a potential conflict of interest.
Advisory relationship. Reading this article does not create an adviser-client relationship. Advisory services are provided only under a written agreement and in jurisdictions where properly registered or exempt.